
Backtesting with real trading costs
See how a strategy would have traded before any money is at risk.
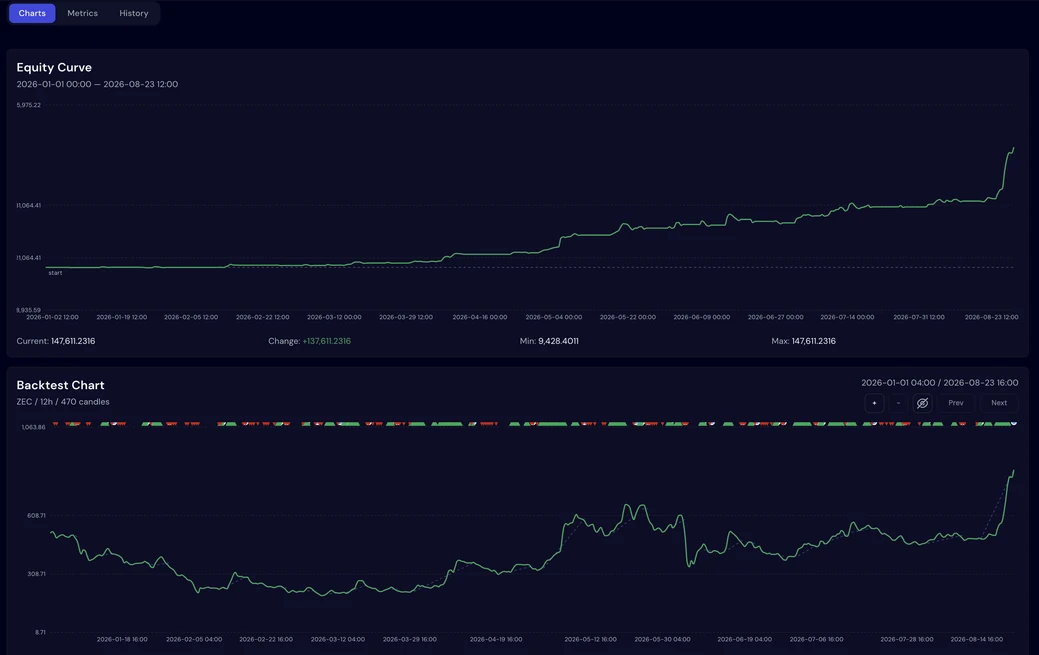
Run any strategy against real market history and read the whole result, not just a profit number.
Fees and slippage are part of every test, so what you see is closer to what live trading would give you.
What you get with backtesting
Fees and slippage included
Every backtest applies trading costs, so results reflect how orders would actually fill.
A full set of metrics
Win rate, Sharpe, Sortino, max drawdown, profit factor, expectancy and more, all in one view.
Compare side by side
Put backtests next to each other, clone the best setups and keep refining.
How it works
- 1
Pick a strategy, a market and a time period.
- 2
Choose your candle size and run the backtest.
- 3
Read the equity curve, the trades on the chart and every metric, then adjust and run again.